Browse Research
|
John Muir Trust study:
Impacts of Wind Farms on Upland
Habitats |
Commentary
|
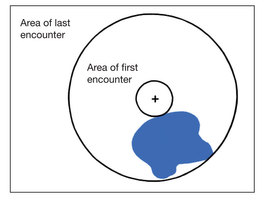
Consequences of
Habitat Fragmentation Explained through a Simple Experiment
|
Effects of Habitat
Fragmentation on Birds and Mammals in Landscapes
with Different Proportions of Suitable Habitat: A Review |
Effects
of Habitat Fragementation on Biodiversity |
Habitat
Fragmentation Effects on Birds in Grasslands and Wetlands: A Critique
of Our Knowledge (full article) |
Diverse and
Contrasting Effects of Habitat Fragmentation |
Sounding the Depths II: (PDF)
The Rising Toll of Sonar,
Shipping and Industrial Ocean Noise on Marine Life |
Long
Point Waterfowl: Importance of the Lower Great Lakes for Waterfowl and
the potential impact of Wind Turbine Development. (This is a 9.8MB file so please be
patient :-) )
Long Point Waterfowl site
Long
Point Waterfowl Blog
|
Low-frequency sounds induce acoustic
trauma in cephalopods, Andre et al 2011 View Abstract online View Article online Download PDF
|
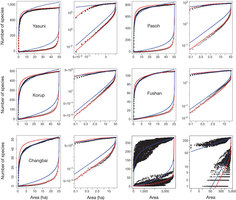
Species–area relationships always overestimate
extinction rates from habitat loss |